Project 1: Temperature Monitoring and Analysis for Food Safety in Meal Delivery
Project Description:This project focuses on monitoring and analysing temperature data at critical control points to ensure food safety during the meal preparation, storage, and delivery process for the Meals on Wheels program. The objective is to use confidence intervals to determine safe temperature ranges and identify any deviations from regulations.
Context and Background:
Food safety is a critical concern in the meal delivery industry, as improper handling, storage, or transportation of meals can lead to foodborne illnesses and pose serious health risks to consumers. The Meals on Wheels program, which delivers nutritious meals to elderly, disabled, or homebound individuals, has a particular responsibility to ensure the highest standards of food safety.
This project aimed to monitor and analyse temperature data at various stages of the meal preparation and delivery process, including cooking, storage, and transportation. By capturing temperature readings at these critical control points, the objective was to determine safe temperature ranges and identify any deviations from food safety regulations. Maintaining appropriate temperatures is crucial for preventing the growth of harmful bacteria and ensuring the delivery of safe and high-quality meals to clients.
Key Findings and Insights:
Consistent Cooking Temperatures: The analysis revealed that the oven temperature values were tightly clustered around the mean, indicating consistent cooking temperatures. This finding suggests that the cooking process is well-controlled and meets the required temperature standards for food safety.
Variability in Delivery Temperatures: While the cooking temperatures were consistent, the delivery temperature values exhibited greater variability. This variability could be attributed to factors such as transit times, weather conditions, or the quality of insulation during transportation.
Skewness within Acceptable Range: Although slight skewness was observed in the data distributions, the skewness values were within an acceptable range for most statistical analyses, indicating that the data did not significantly violate normality assumptions.
No Significant Outliers: The analysis did not detect any significant outliers in the data, suggesting that the temperature readings were reliable and free from extreme values that could potentially skew the results.
Correlation between Delivery Temperature and Total Daily Deliveries: An interesting finding was the strong negative correlation between delivery temperature and total daily deliveries. This relationship suggests that as the delivery temperature increases, the total daily deliveries tend to decrease significantly, or vice versa. However, further investigation through linear regression did not confirm a strong linear relationship between these two variables.
Safe Temperature Ranges: Ultimately, the calculation of confidence intervals provided reassuring results, indicating that the observed temperatures during the cooking and delivery processes fell within safe and acceptable limits, meeting food safety regulations.
The key components include:
Data Collection:
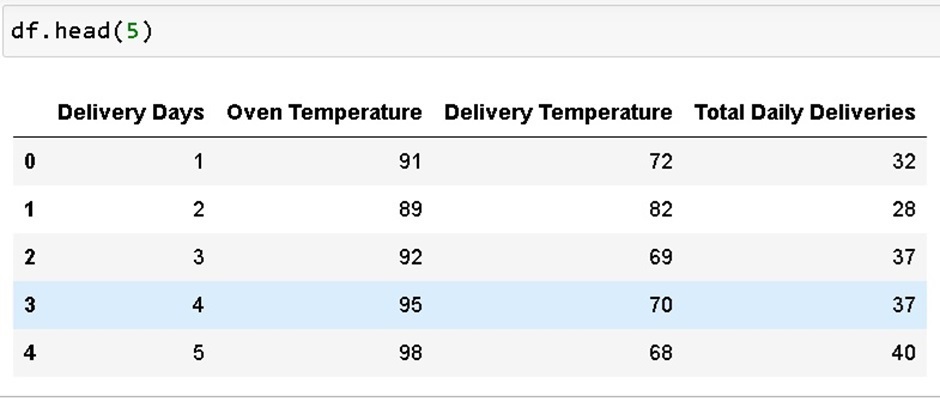
I captured and recorded temperature readings using probes at different stages of the cooking process. This includes after cooking, to verify meals reach safe internal cooking temperatures and at the point of delivery to the client for two weeks. I used a sample of 14 observations captured over time in this analysis. I imported the dataset into Python for the EDA process, telling the story in the end with Microsoft Excel.
Data Analysis:
Inspected the dataset: The data variables do have the proper titles, there are no missing values and no other cleaning process is required at this stage.
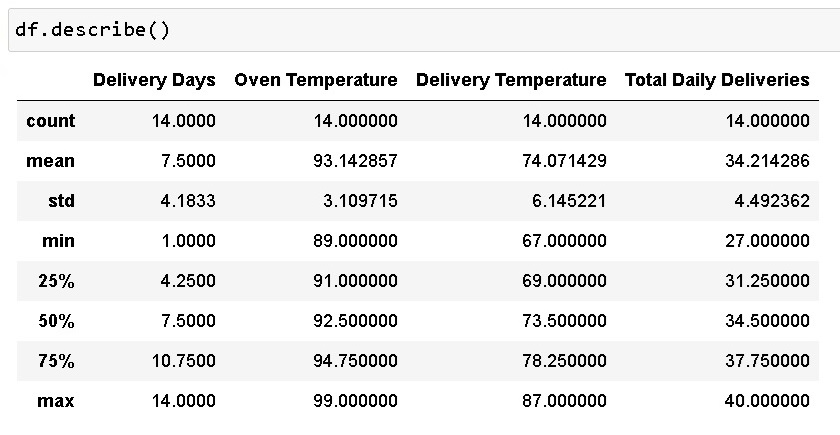
Calculated descriptive statistics.
Oven Temperature:
The standard deviation for Oven Temperature is 3.109715. This relatively low value indicates that the Oven Temperature values are clustered closely around the mean of 93.142857. This standard deviation of 3.109715 suggests that most Oven Temperature values fall within a narrow range, with approximately 68% of the values lying within one standard deviation (between 90.033142 and 96.252572) of the mean.
Delivery Temperature:
The standard deviation for Delivery Temperature is 6.145221.
This value is higher than the standard deviation for Oven Temperature, and it seems to be an indication of greater variability or spread in the Delivery Temperature values. With a mean of 74.071429, a standard deviation of 6.145221 suggests that approximately 68% of the Delivery Temperature values lie between 67.926208 and 80.216650. The higher standard deviation could be due to various factors affecting delivery temperatures, such as transit times and weather conditions. It is impossible to control poor weather conditions but we can mitigate some of these issues by forewarning customers. Where traffic causes delays in delivery times and subsequently affects meal temperature, a bit more effort can be made to inform customers of the delay
Total Daily Deliveries:
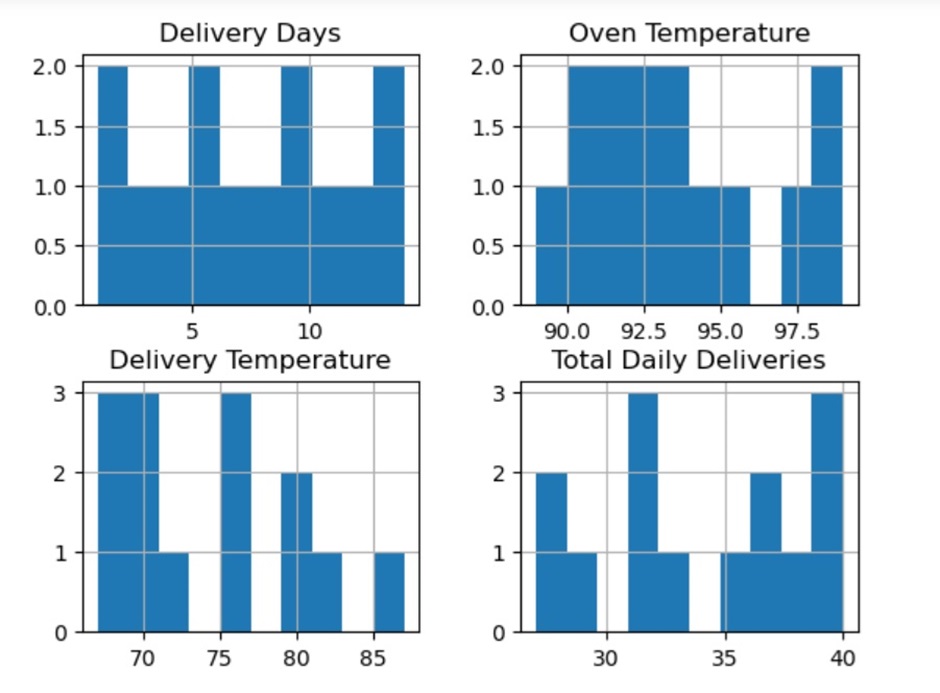
The standard deviation for Total Daily Deliveries is not provided in the output. Without the standard deviation value, it is difficult to comment on the variability or spread of the Total Daily Deliveries data. To obtain proper insight into the distribution I used a histogram. Apart from the mean and standard deviation, there seems to be a little bit of skewness in the data. So, I explored further with a kde chart.
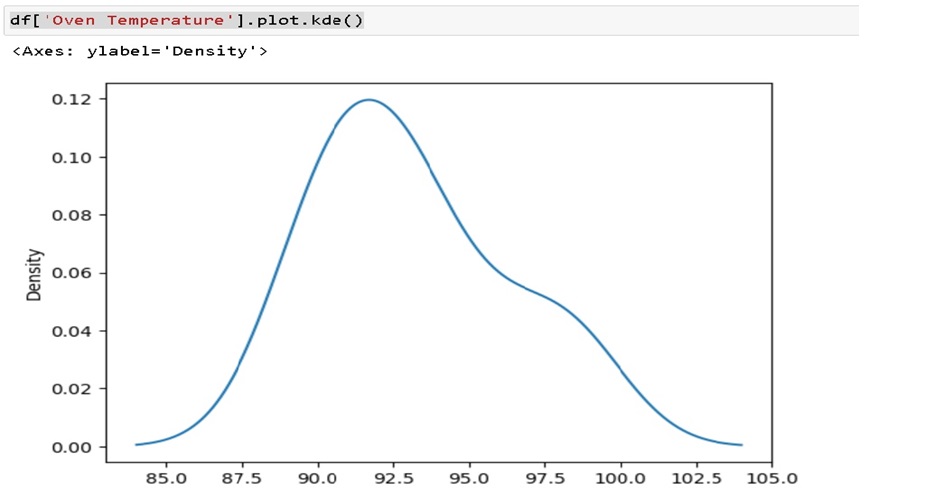
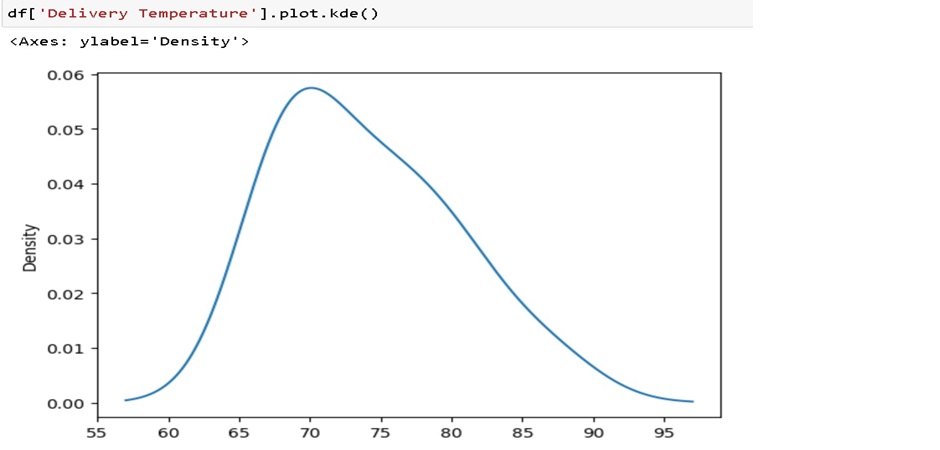
The standard deviation for Oven Temperature is 3.109715. This relatively low value indicates that the Oven Temperature values are clustered Sure enough, the two kde charts above exhibit slight right tails. I need to find out if this asymmetrical shape violates normality assumptions.
Here is the calculation of skewness for the "Oven Temperature" column:
Mean = 93.5
Standard Deviation = 3.11
Cubed differences from mean: (-2.5) ^3 + (-4.5)^3 + ... + (-2.5)^3 = -91.125
Skewness = (14/((14-1)*(14-2))) * (-91.125) / (3.11)^3 = -0.36
Negative skewness indicates the distribution is skewed left (longer tail on the left).
For "Delivery Temperature":
Mean = 73.93, Std Dev = 5.75
Skewness = 0.12 (slightly right skewed)
For "Total Daily Deliveries":
Mean = 35.14, Std Dev = 4.38
Skewness = -0.44 (moderately left-skewed)
According to my research, the skewness values of 0.12 and -0.44 are likely within an acceptable range for most analyses, with the skewness of 0.12 being closer to perfect symmetry than -0.44. The next thing was to determine if there were any outliers in the observed data so I used both the scatter plot and the box plot to achieve this.
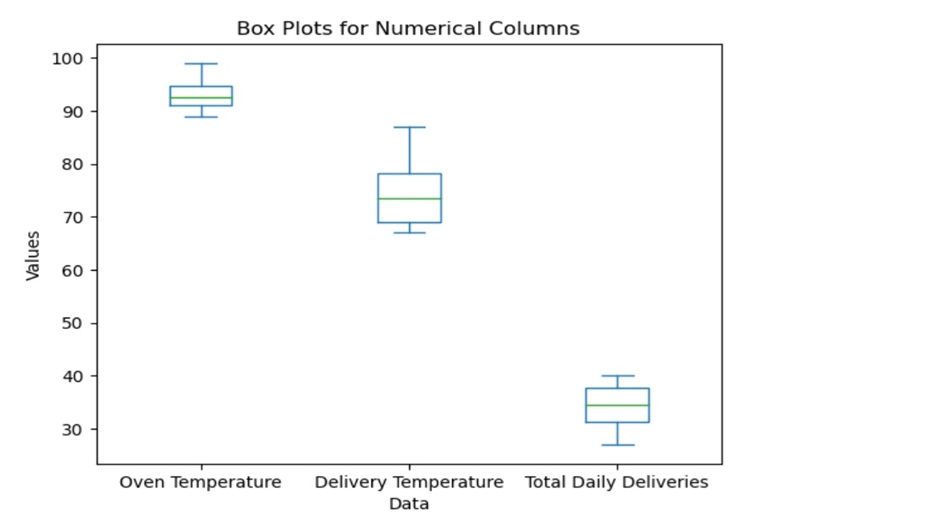
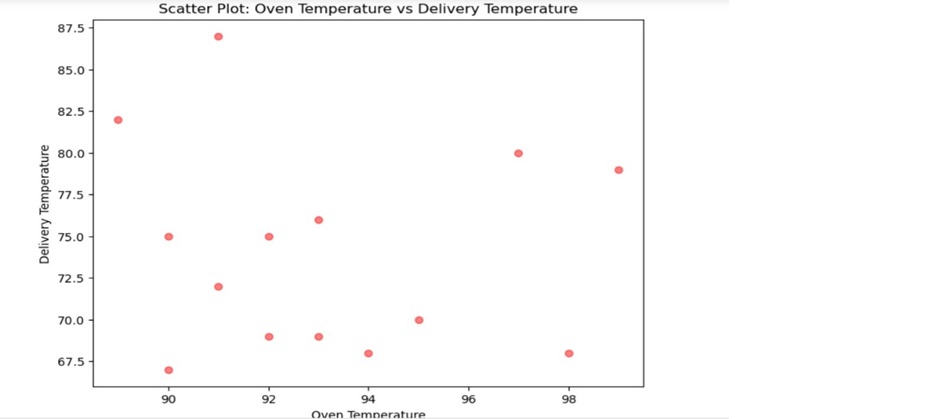
And, with no sign of outliers from the box and scatter plot, it is time to see if there exists a relationship between any of the variables. It is time to perform correlation analysis. The result looks interesting as we will soon find out.
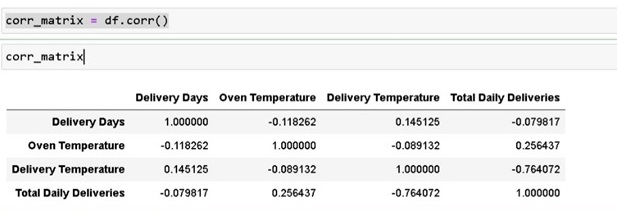
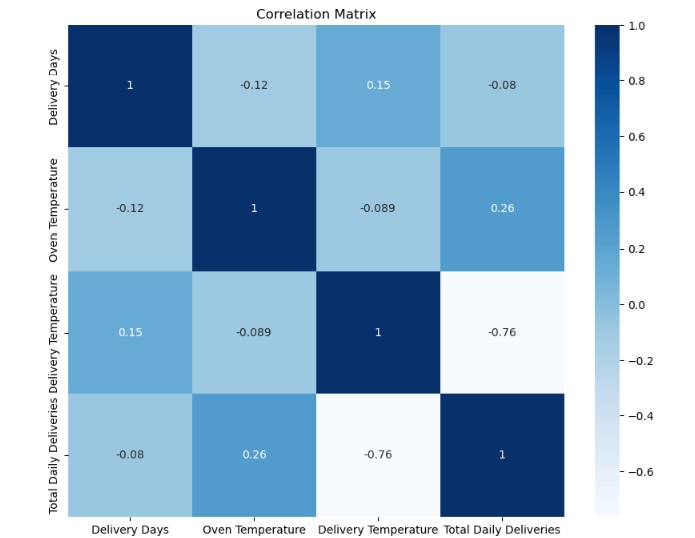
This matrix shows the pairwise correlation coefficients between all the numerical variables. Delivery Days vs. Oven Temperature: The correlation coefficient is -0.118262, and it is an indication of a weak negative correlation between these two variables. This means that as the Delivery Days increase, the Oven Temperature tends to slightly decrease, or vice versa.
Delivery Days vs. Delivery Temperature: The correlation coefficient is 0.145125, which indicates a weak positive correlation between these two variables. This means that as the Delivery Days increase, the Delivery Temperature also tends to slightly increase, or vice versa. The above two do not communicate much as the number of days is only a reflection of recording periods and not an increase in the number of days.
Delivery Days vs. Total Daily Deliveries: The correlation coefficient is -0.079817, which indicates a very weak negative correlation between these two variables. This suggests that there is almost no linear relationship between Delivery Days and Total Daily Deliveries.
Oven Temperature vs. Delivery Temperature: The correlation coefficient is -0.089132, which indicates a very weak negative correlation between these two variables. This suggests that there is almost no linear relationship between Oven Temperature and Delivery Temperature.
Oven Temperature vs. Total Daily Deliveries: The correlation coefficient is 0.256437, which indicates a weak positive correlation between these two variables. This means that as the Oven Temperature increases, the Total Daily Deliveries also tend to slightly increase, or vice versa.
Delivery Temperature vs. Total Daily Deliveries: The correlation coefficient is -0.764072, which indicates a strong negative correlation between these two variables. This means that as the Delivery Temperature increases, the Total Daily Deliveries tend to decrease significantly, or vice versa and generate some kind of interest. So, I will next perform a linear regression to see if there is a strong relationship between these two variables.
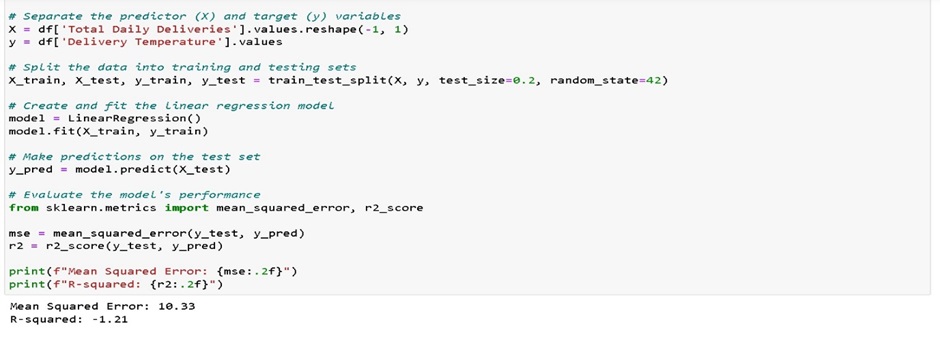
Contrary to the correlation analysis, there does not seem to be any strong relationship between the Total Daily Deliveries and Delivery Temperatures. Further investigation into this relationship or the use of non-linear models could provide additional insights. The last task is to calculate the confidence interval and determine where the population lie.
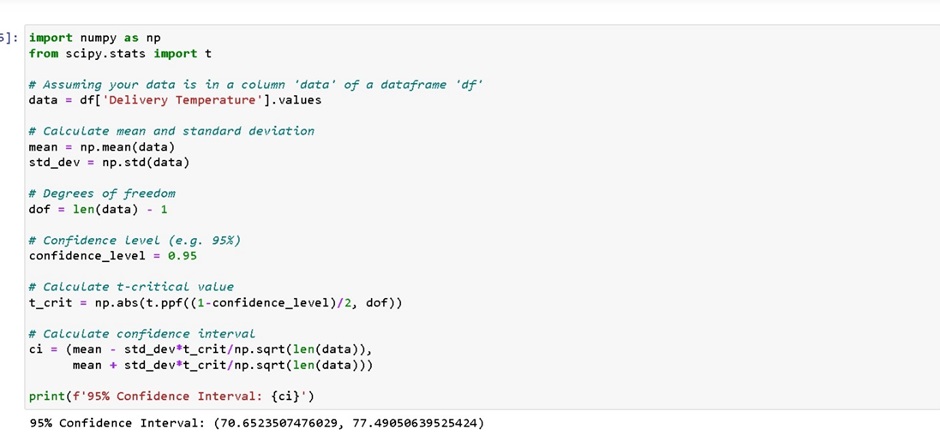
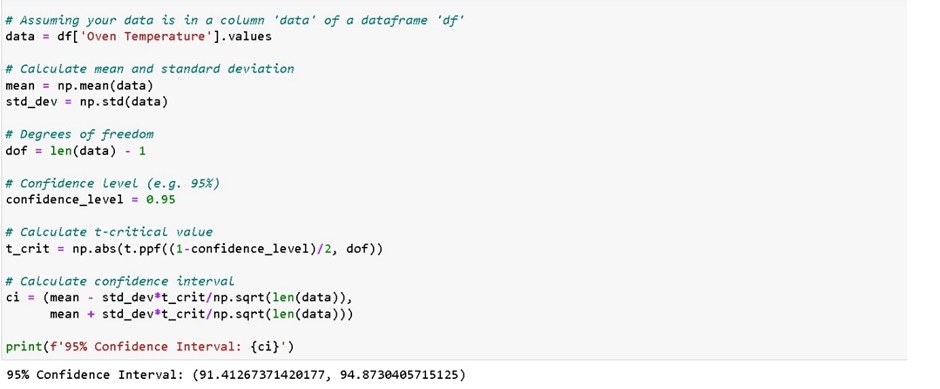
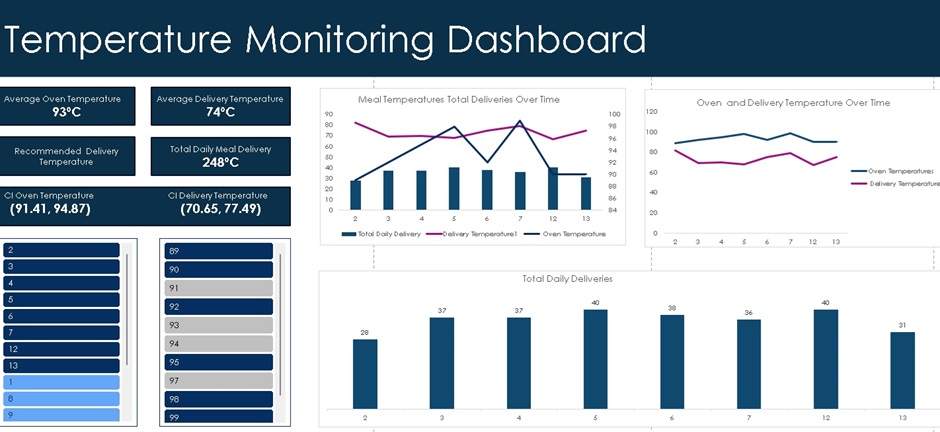
The confidence level for the Oven Temperature is 95% with a Confidence Interval: (91.41267371420177, 94.8730405715125) while the confidence level of 95% generated a Confidence Interval: (70.6523507476029, 77.49050639525424). This is pretty good news for us. Here is the data visualisation that tells the story of this project.
Recommendations:
Continuous Monitoring: While the current practices appear effective in maintaining safe temperature ranges, continuous monitoring and analysis should be conducted to identify any potential deviations or areas for improvement in the future.
Investigate Delivery Temperature Variability: Further investigation into the factors contributing to the variability in delivery temperatures could lead to improvements in insulation, transportation methods, or route planning to ensure more consistent and safe delivery temperatures.
Explore Relationship between Delivery Temperature and Total Daily Deliveries: Although linear regression did not confirm a strong linear relationship, exploring alternative modelling techniques or considering other variables could provide additional insights into the observed correlation between delivery temperature and total daily deliveries.
Conclusion:
This project aimed to monitor and analyse temperature data at critical control points during the meal preparation, storage, and delivery process for the Meals on Wheels program. The objective was to use confidence intervals to determine safe temperature ranges and identify any deviations from regulations, ensuring food safety for the clients.
Though, I did not have enough data to explore some other aspects of health and safety issues due to data security, nevertheless, I believe I have achieved what I set out to accomplish.
Through exploratory data analysis, we gained valuable insights into the temperature data collected over two weeks. The analysis revealed that the oven temperature values were tightly clustered around the mean, indicating consistent cooking temperatures. However, the delivery temperature values exhibited greater variability, potentially due to factors such as transit times, weather conditions, or insulation quality during transportation.
While slight skewness was observed in the data distributions, the skewness values were within an acceptable range for most statistical analyses. Additionally, no significant outliers were detected, suggesting the data was relatively clean and reliable.
Correlation analysis revealed an interesting finding: a strong negative correlation between delivery temperature and total daily deliveries. This relationship suggests that as the delivery temperature increases, the total daily deliveries tend to decrease significantly, or vice versa. However, further investigation through linear regression did not confirm a strong linear relationship between these two variables.
Ultimately, the calculation of confidence intervals provided reassuring results. The 95% confidence interval for oven temperature was (91.41, 94.87), while the 95% confidence interval for delivery temperature was (70.65, 77.49). These ranges indicate that the observed temperatures during the cooking and delivery processes fell within safe and acceptable limits, meeting food safety regulations.
So, effectively, this project successfully monitored and analysed temperature data at critical control points, providing valuable insights into the meal preparation and delivery process. The findings suggest that the current practices are effective in maintaining safe temperature ranges and ensuring the delivery of high-quality meals to clients. However, continuous monitoring and analysis should be conducted to identify any potential deviations or areas for improvement in the future.