Project 2:Empowering Women's Leadership: A Multidimensional Approach to Addressing Gender Disparities Across SDG Regions and Sectors
Introduction:Despite efforts towards gender equality, a substantial gap persists in women's representation in leadership positions worldwide. According to United Nations data, while the number of women in leadership roles has increased, they remain underrepresented in top management compared to men. This imbalance raises concerns about equity, organizational performance, decision-making, and effective utilization of human capital.
Research Question and Objectives:
This analysis leverages United Nations data to explore the patterns and trends in the percentage of women in leadership positions across various SDG regions. The primary research question is:
What are the patterns and trends in the percentage of women in leadership positions across different SDG regions, and do these percentages significantly differ among the regions?
To address the issues, the analysis will center on :
Context and Importance: Highlight the significance of gender equality and women’s empowerment, as outlined in SDG 5 of the United Nations’ 2030 Agenda for Sustainable Development.
Patterns and Trends: Analyse the percentage of women in leadership positions across different SDG regions over time and identify significant regional differences.
Potential Barriers and Enablers: Identify systemic biases, social norms, and lack of representation as barriers, and promote gender diversity policies, mentorship, inclusive cultures, and equal access to resources as enablers.
By examining the factors that hinder or facilitate women's advancement into leadership roles, this analysis aims to provide insights that can inform strategies for promoting greater gender balance and inclusivity in leadership positions. The analysis will explore dimensions such as SDG regions and socioeconomic factors through descriptive statistics, hypothesis testing, and regression modelling to investigate correlations and quantify the impact of various variables on women's representation in leadership.
Furthermore, the analysis seeks to identify specific SDG goals that potentially enable increased participation of women in leadership roles. Shedding light on the barriers and enablers influencing women's leadership aims to contribute to the ongoing discourse on gender equality, and provide data-driven recommendations for empowering women in leadership across diverse sectors and regions.
Recommendations
The recommendations aim to promote gender diversity in leadership roles through a comprehensive approach.
• Firstly, tailored regional strategies should be developed to address unique barriers, focusing on legal protections and educational access in areas with low female leadership representation. Successful practices should be shared between regions with high and low representation.
• Data quality and analysis enhancements are crucial, including improving data completeness through advanced imputation techniques and conducting longitudinal studies to track progress over time.
• Organizations should be encouraged to adopt and enforce gender diversity policies, setting targets for female representation and ensuring transparent recruitment processes. Regular monitoring and reporting mechanisms should hold organizations accountable.
• Supportive workplace policies, such as work-life balance initiatives, parental leave, flexible hours, and on-site childcare facilities, should be promoted.
• Mentorship and sponsorship programs can connect women with experienced leaders for guidance and advocacy. Cultural shifts are necessary through awareness campaigns challenging gender norms and stereotypes, while highlighting successful female role models.
• Economic empowerment initiatives are vital, providing women with access to financial resources like loans and grants to support entrepreneurial ventures and career growth. Programs specifically designed for women entrepreneurs, including business development services, networking opportunities, and market access, should be created.
By implementing these multifaceted strategies, organizations and societies can foster an environment that supports and promotes gender diversity in leadership positions.
Exploratory Data Analysis:
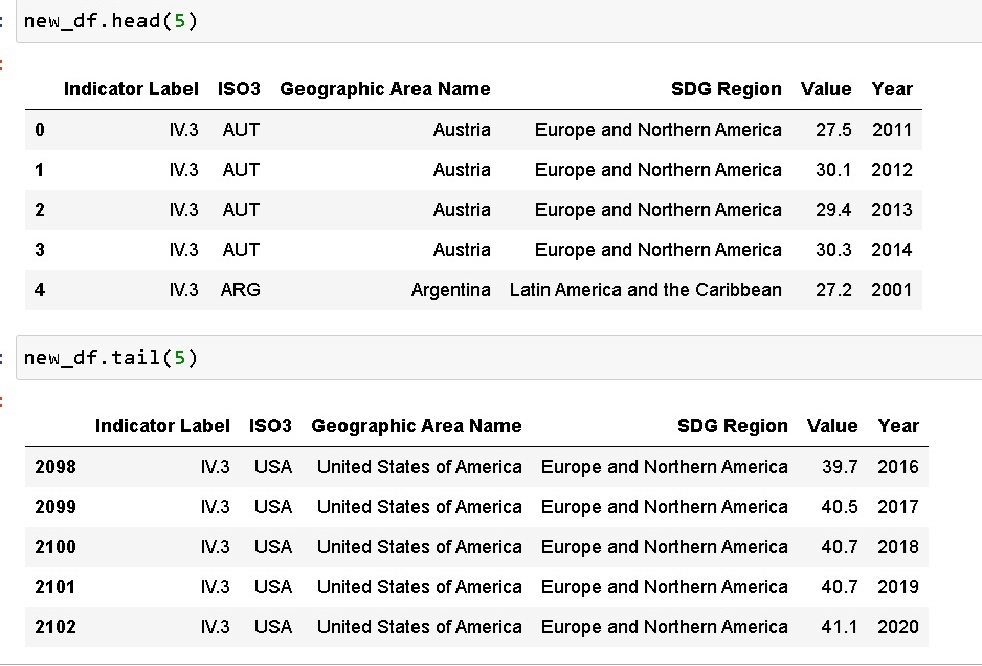
The data collection process involved importing the SDG leadership file from the UN website to Python, converting it into a data frame for analysis. The data contained 28 variables with 2103 rows spanning from 2000 to 2022. Functions such as df.shape, df.head(), df.tail(), and df.columns() were used to explore the data.
Missing values were substituted with the mean to avoid losing important details and also to limit any bias. The Year column was reformatted from an integer to a date data type. Variables of interest were selected, and summary statistics were performed on the Value column, which contains the percentage of women across different social development groups and regions. This was visualized with a histogram.Below are the variables of interest:
Calculated descriptive statistics.
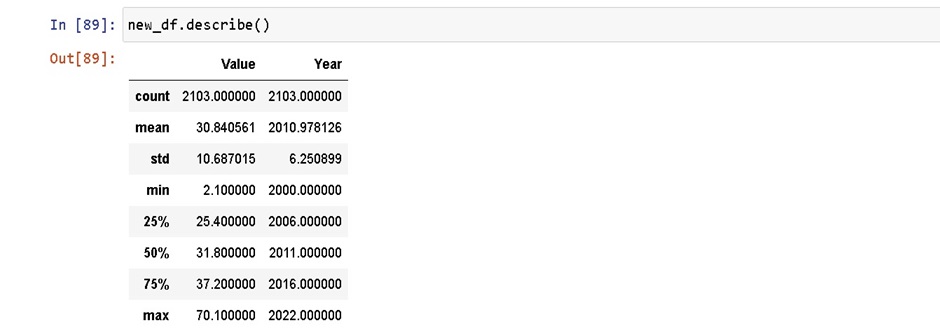
The summary statistics shows that most of the data points are distributed around the central value of 30.840561. With 10.687015 standard deviation units away from the mean, there seem to be a fairly dispersed distribution of data points away from the central average value, so that 68% of the values lie within +- 1 standard deviation, while 99.7% of the data points fall within 3 standard deviations of the mean.
Histogram
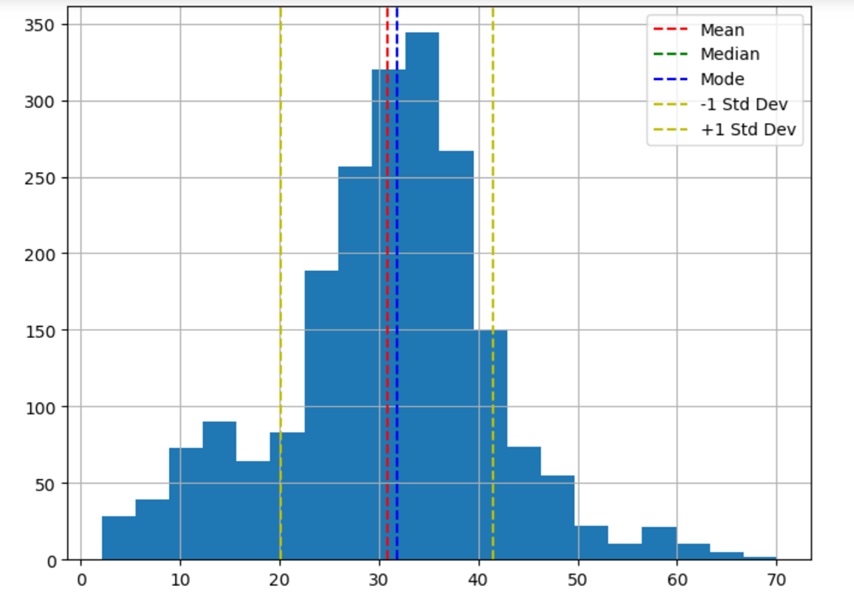
The standard deviation for Oven Temperature is 3.109715. This relatively low value indicates that the Oven Temperature values are clustered closely around the mean of 93.142857. This standard deviation of 3.109715 suggests that most Oven Temperature values fall within a narrow range, with approximately 68% of the values lying within one standard deviation (between 90.033142 and 96.252572) of the mean. Below is a density plot.
Density plot
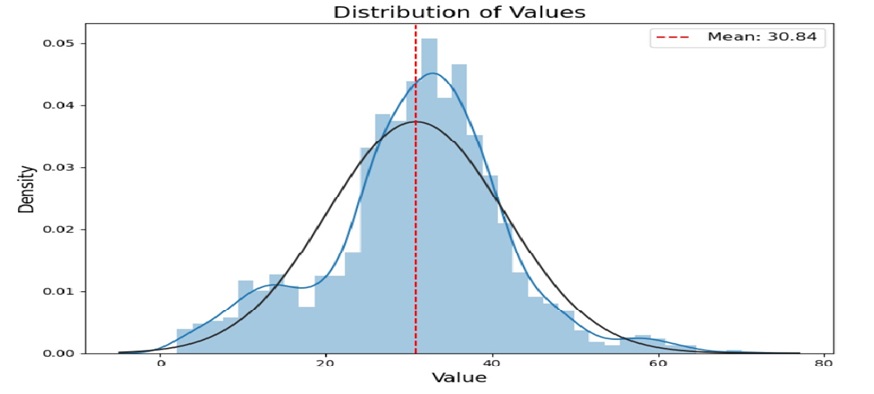
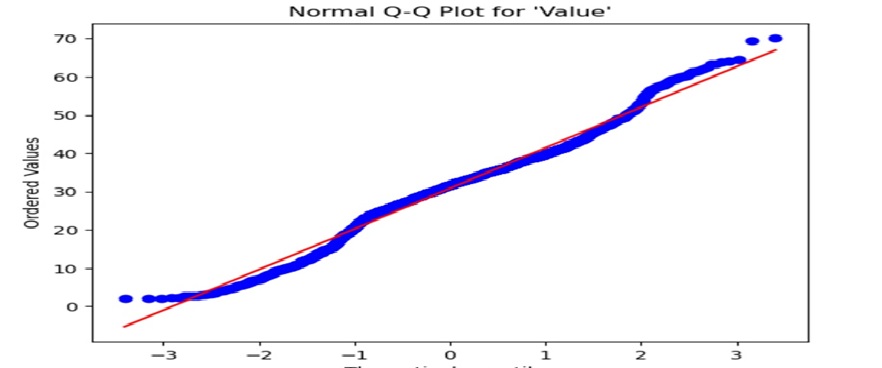
A Q-Q plot placed everything in context, showing that the points deviate slightly from a normal distribution and, the dataset contains outliers as well.
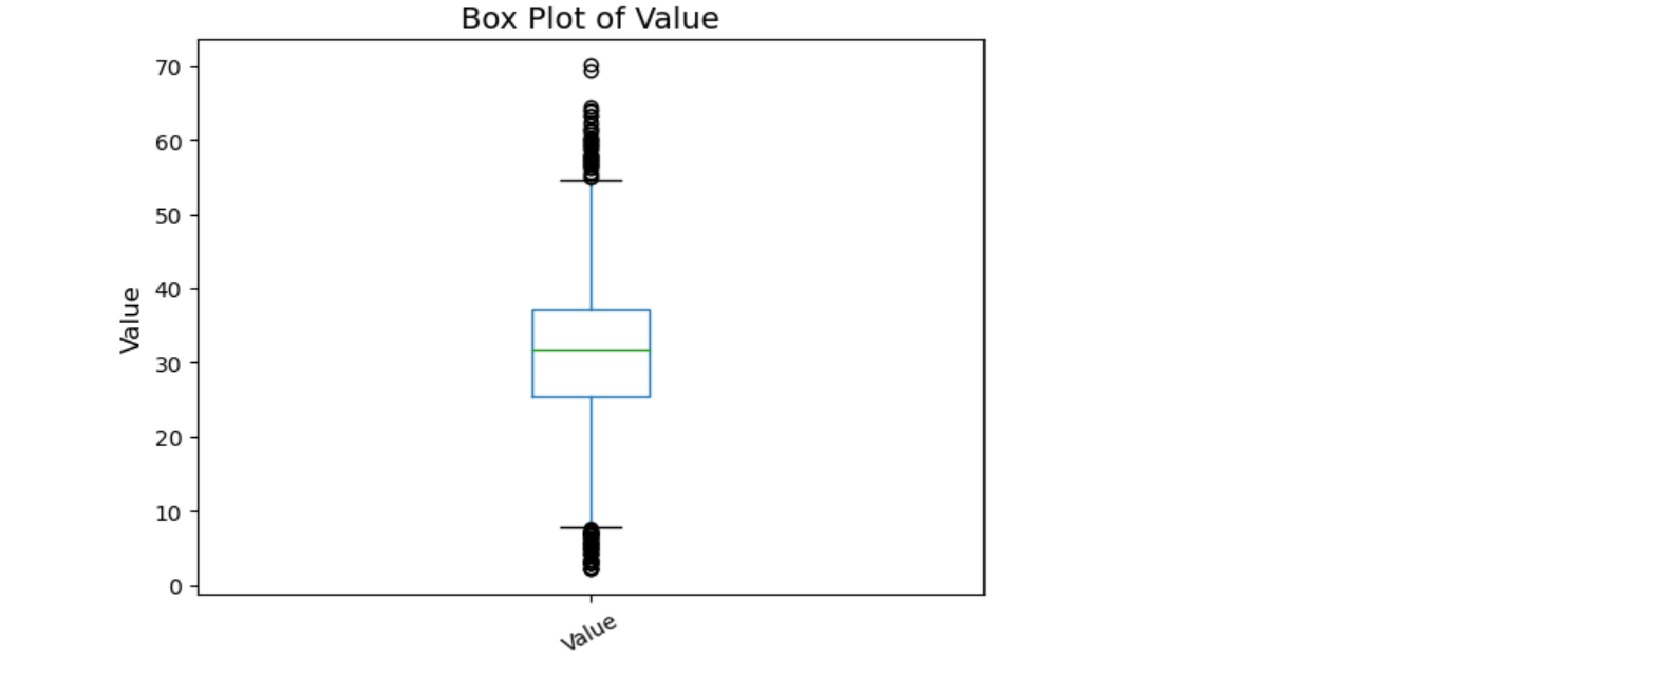
The boxplot below tells the full story of the outliers, demonstrating extreme values at both the upper and lower end of the values, yet the outliers can be overlooked, otherwise, the median would have been the appropriate measure for the central tendency.
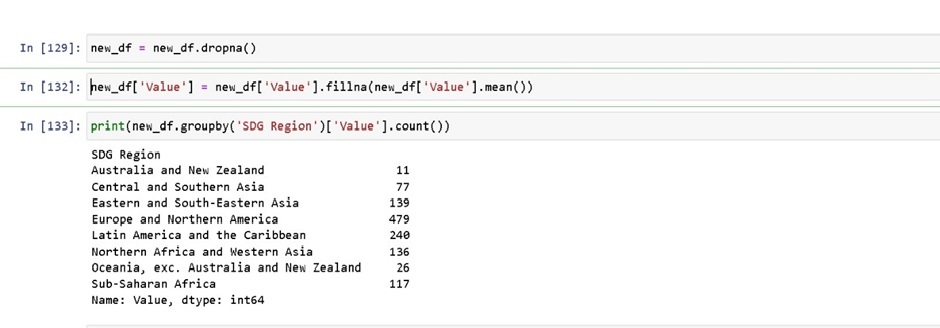
Analysing the patterns and trends of the data First, I grouped the data into their various SDG geographical regions and charted the percentage of women in leadership across these groups. The result unlocked some interesting insight.
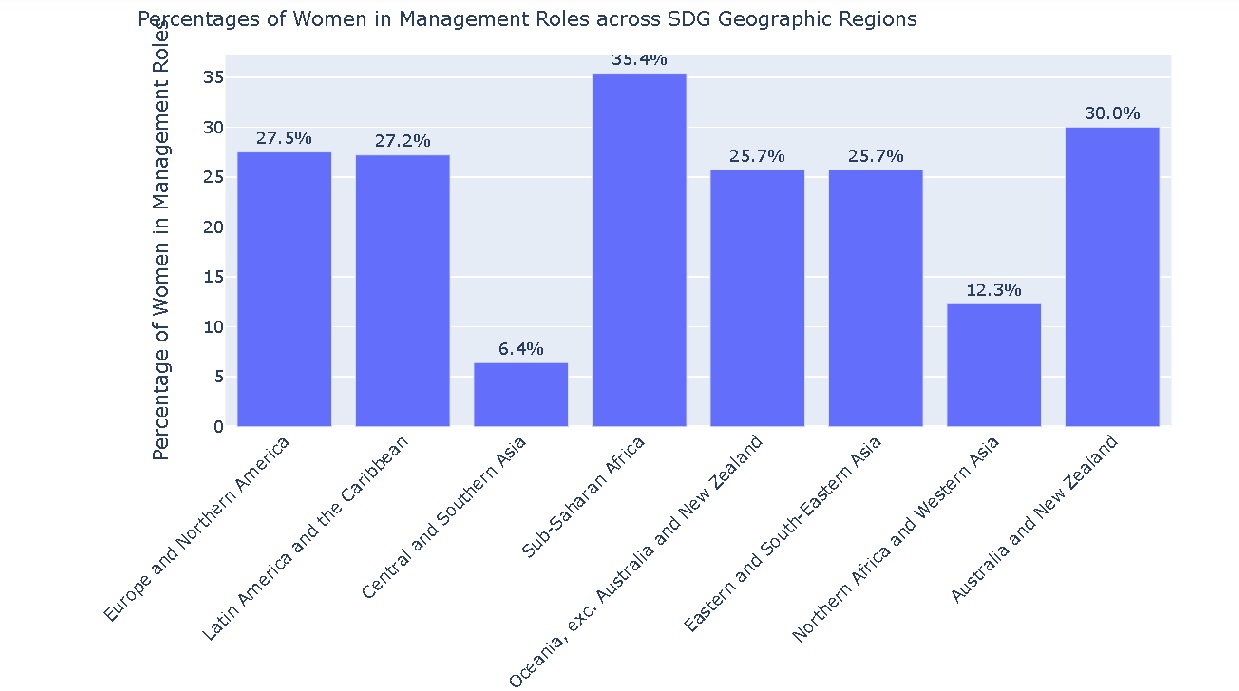
Europe and North America have the largest proportion of women in leadership position with a percentage of 39.1%, followed closely by Central and Southern Asia with 38.6%. North Africa and western Asia and Oceanic exc. plus Australia and New Zealand represents the third and fourth largest regions with women in management accounting for 34.4% and 33.3% respectively.
Women in Latin America and the Caribbean region represents the smallest group of women in leadership roles in the SDG regions with a percentage of 6.4%. These low and varying proportion of women in leadership roles highlights some differing barriers in the various SDG regions. These barriers include:
• Discriminatory laws and lack of legal protections against gender discrimination perpetuate biases hindering women's advancement. Deeply-rooted gender norms and stereotype manifest in workplace cultures and hiring practices, limiting opportunities.
• Access to quality education and skills development is lacking in some areas, reducing competitiveness for leadership roles. Inadequate supportive policies like parental leave and childcare disproportionately impact work-life balance for women.
• Limited access to finance and economic resources constrains entrepreneurship and career growth. Shortage of female role models and mentors creates a self-perpetuating cycle.
• Entrenched cultural and traditional norms restrict women's workforce participation and decision-making power.
• Regions affected by conflict, instability and humanitarian crises face disruptions that disproportionately impact women's career prospects.
Overcoming these multifaceted barriers requires legal reforms, policy interventions, educational initiatives, targeted support programs and cultural shifts to empower women in leadership across all regions.
Seasonal Decomposition
I decomposed the time series to obtain the general pattern and trend of the SDG groups.
Linear regression to determine the long-term trend
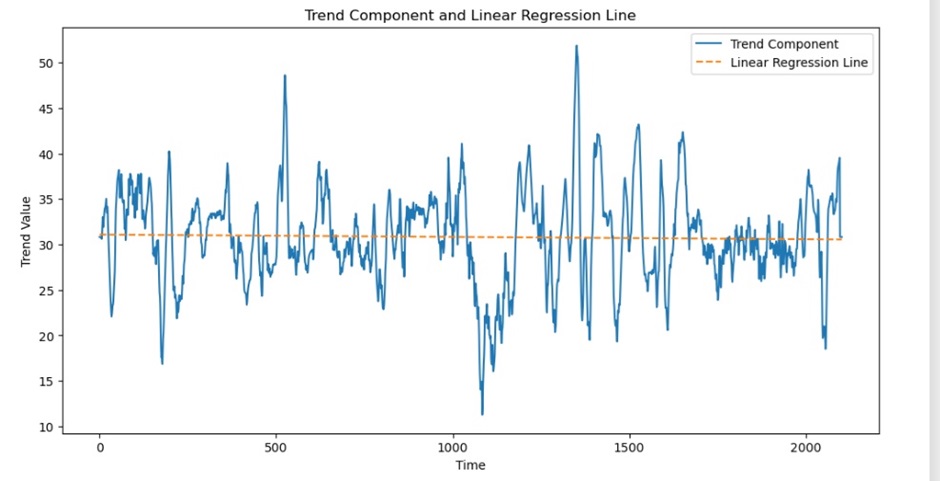
The constant trend component value of 30.818245 and the very shallow slope of the fitted linear regression line (close to 0) suggest that there is no substantial long-term trend (upward or downward) in the time series data you are analysing. The decomposition method has likely identified and removed any minor trends, leaving a relatively flat or horizontal trend component. The slope indicates a very slight downward trend but the trend is so weak that it can be considered almost flat or negligible over the period. It is reflected in the trend component of -0.00.
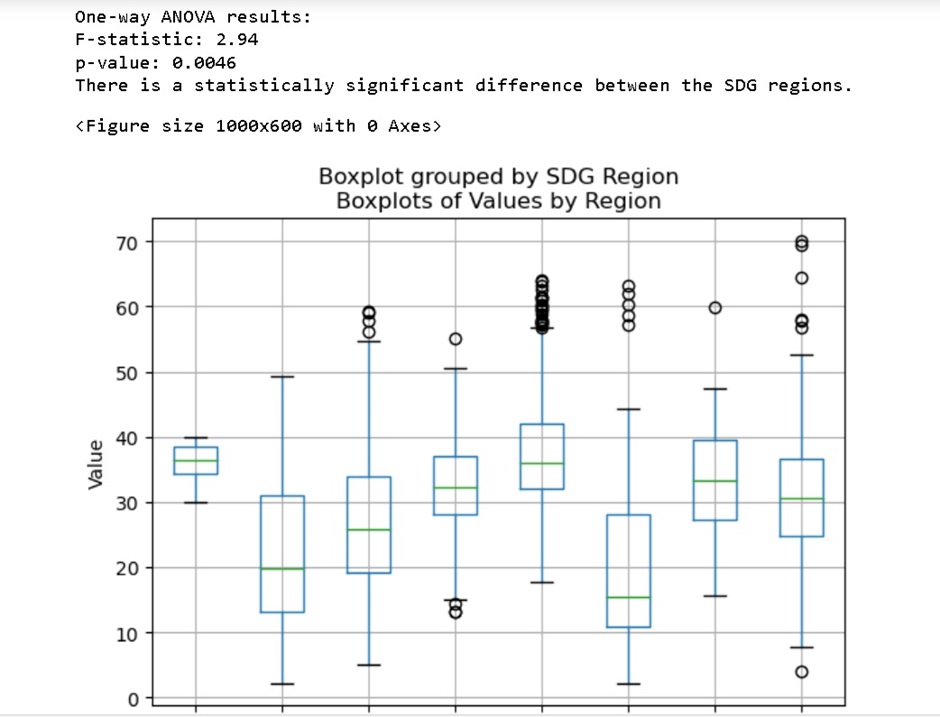
Hypothesis testing
Null Hypothesis (H0): The mean percentage of women in leadership positions is equal across all SDG regions.
Alternative Hypothesis (Ha): At least one SDG region has a different mean percentage of women in leadership positions compared to the other regions.
To do this I applied the ANOVA test, using the F-statistic and P-Value in particular. The F-statistic is a ratio that compares the variance between groups to the variance within groups. The P-value represents the probability of obtaining the calculated F-statistic (or an even more extreme value), assuming the null hypothesis of equal group means is true.
The outcome indicates that there is a statistically significant difference between the SDG regions predicated on the on the fact that p-value is less than 0.05 and F-statistic = 2.94. In summary, One-way ANOVA results (F-statistic = 2.94, P-value = 0.0046) indicate a statistically significant difference in the means across the SDG groups as seen in the
Limitations
I do recognize the limitation in the potential of using other alternative statistical models in exploring the data. The data exploration and recommendations are, however, predicated on the available data and must be considered in this report.
Conclusion
The persistent underrepresentation of women in leadership positions across regions and sectors demands a comprehensive and multidimensional approach. By implementing tailored regional strategies, enhancing data quality, promoting organizational policies, fostering supportive workplace environments, driving cultural shifts, and enabling economic empowerment, organizations and societies can create an environment conducive to gender diversity in leadership.
This multifaceted approach addresses systemic barriers, organizational practices, cultural norms, and individual support systems, ultimately contributing to greater gender equality, organizational performance, and effective utilization of human capital. Empowering women's leadership is a crucial step towards achieving the United Nations' Sustainable Development Goals and promoting inclusive and sustainable development across diverse sectors and regions. See Dashboard