Project 3:Apple Inc. Stock Analysis - Using SQL and R
Project Description:The primary objective of this project is to perform a comprehensive analysis of Apple Inc.'s stock data to uncover insights into its historical performance, trends, and patterns. By leveraging SQL for data extraction and manipulation, and R for data visualization and statistical analysis, this project aims to:
• Calculate key descriptive statistics to understand the overall performance of Apple Inc.'s stock.
• Measure daily price changes and percentage changes to assess stock volatility.
• Calculate correlations between different stock variables (e.g., Open, Close, Volume) to identify significant relationships.
• Use correlation analysis to inform potential investment strategies.
• Provide Actionable Insights
• Generate visualizations to effectively communicate findings and trends.
• Summarize key insights and provide recommendations based on the analysis.
By achieving these objectives, this project aims to provide a detailed understanding of Apple Inc.'s stock performance, support data-driven decision-making, and demonstrate proficiency in data analysis using SQL and R.
I obtained the data from Yahoo Finance spanning the period of May 2023 to May 2024 and imported it into SQL. Preprocessing included formatting it with the appropriate data types and columns (Date, Open, High, Low, Close, Adj Close, Volume) in a table and database. I also imported the data into R studio, ensuring once again that I have the proper data formats and used libraries like (ggplot2, dplyr, and tidyverse) to obtain the required result.
The task concentrates on: Daily price changes
• Monthly and yearly aggregates
• Moving averages
• Volatility analysis
• Volume analysis
• Price trends
• Correlation analysis
----- Descriptive statistics all stock Average Closing Price: $182.21. Highest Closing Price: $198.11
Lowest Closing Price: $165. Average Daily Trading Volume: 58,286,454 shares
Calculated descriptive statistics.
Daily Price Changes
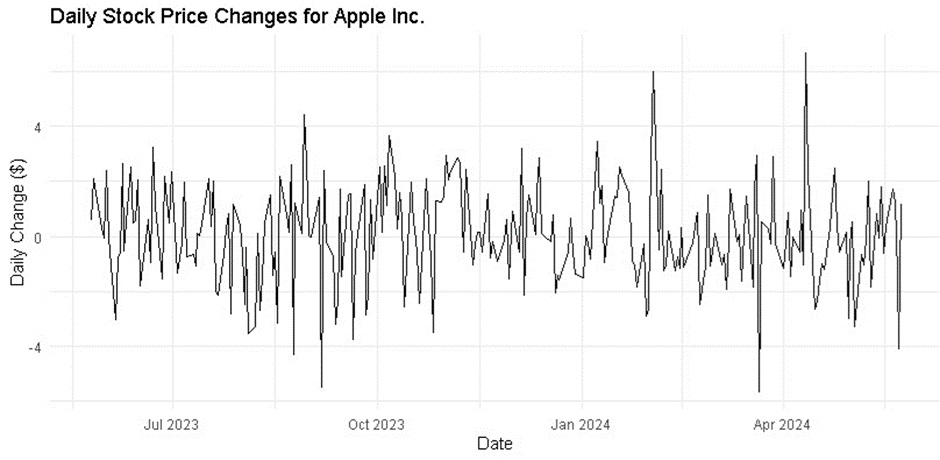
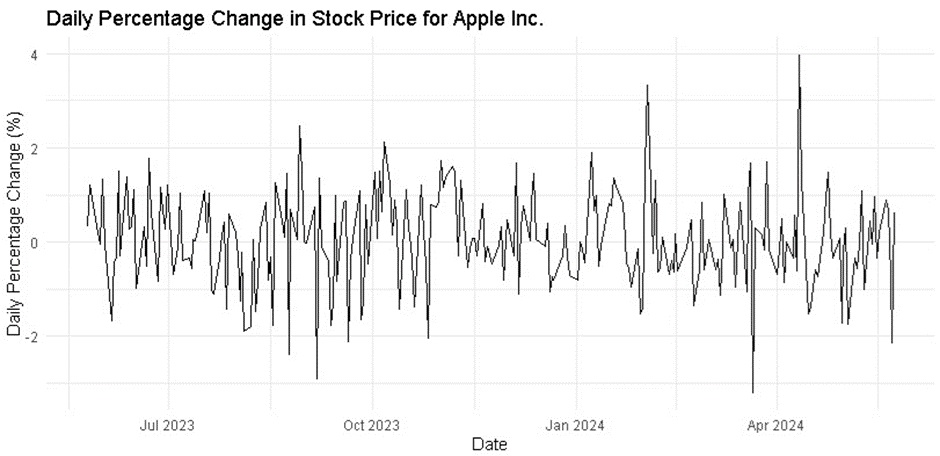
Daily price changes and percentage changes were calculated to assess stock volatility.
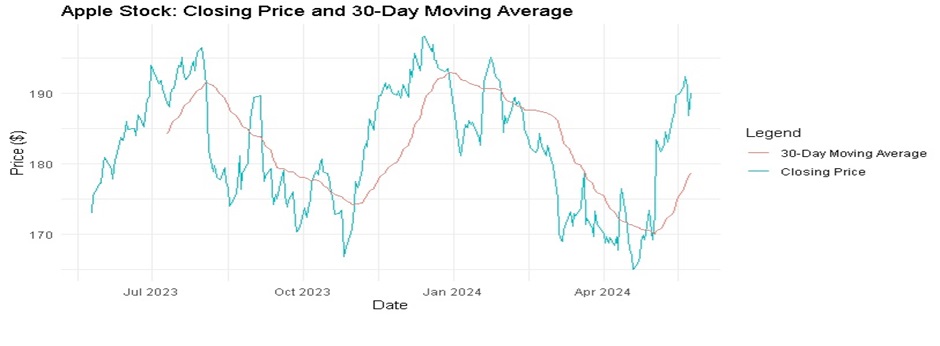
7-day Moving Average: Calculated to smooth out short-term fluctuations.

Volatility Analysis
Standard Deviation of Daily Closing Prices: 8.44
Average Daily Range (High - Low): 2.87
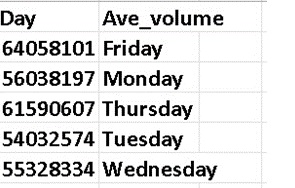
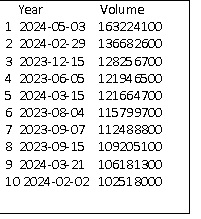
Volume Analysis
Days with the Highest Trading Volume: May 3, 2024, had the highest volume with 163,224,100 shares.
Average Trading Volume for Each Day of the Week: Friday had the highest average volume.
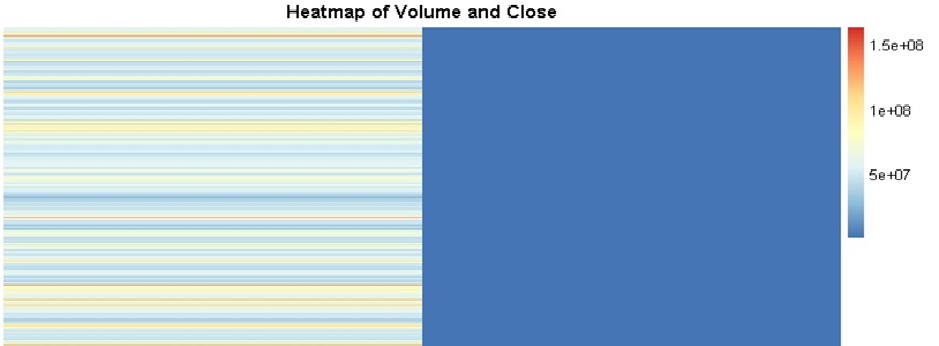
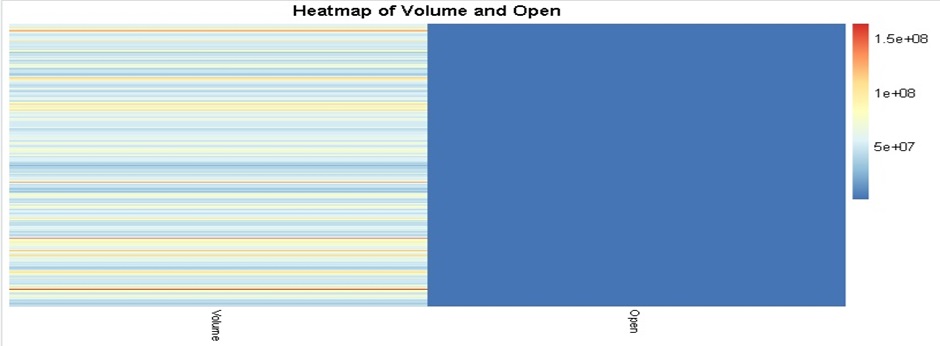
Correlation Analysis:
Between Daily Trading Volume and Closing Price: Negative correlation (-0.206).
Between Opening Price and Closing Price: Very strong positive correlation (0.977).
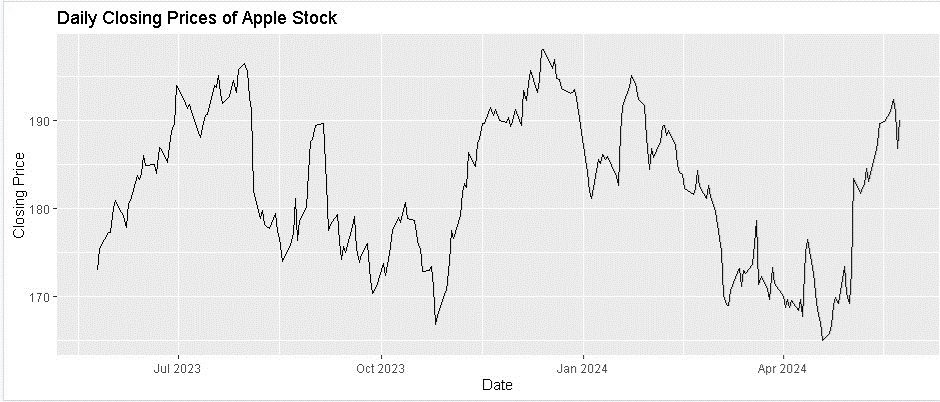
Visualization Highlights
Daily Closing Prices
Monthly and Yearly Aggregates
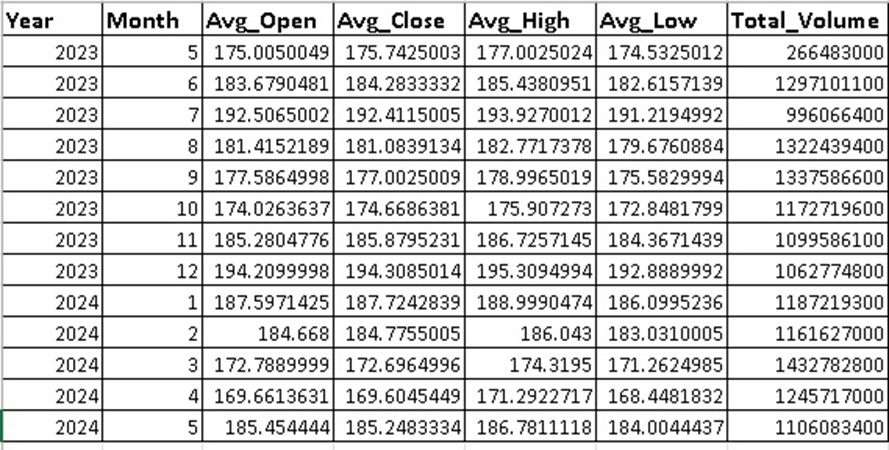
Average Monthly Closing Prices: Fluctuations observed over different months.
Total Trading Volume for Each Month: Significant variations in trading volumes across months.
Average Yearly Closing Prices: $183.83 (2023) and $179.78 (2024).
ORDER BY Volume DESC;
30-day Moving Average: Highlighted longer-term trends.
Monthly Average Opening, Closing, High and Low prices with Total Volume Analysis
Insights and Conclusions
Key Findings
Descriptive Statistics: The average closing price is $182.21, with the highest and lowest closing prices being $198.11 and $165, respectively.
Daily Price Changes: Daily price changes and percentage changes indicate stock volatility.
Monthly and Yearly Aggregates: Monthly and yearly aggregates show fluctuations in closing prices and trading volumes.
Moving Averages: Moving averages help in understanding short-term and long-term trends.
Volatility Analysis: The standard deviation and average daily range provide insights into price volatility.
Volume Analysis: Identified days with the highest trading volumes and average volumes for each day of the week. Correlation Analysis: Found significant correlations between different stock variables.
Recommendations:
Investment Strategies: Leverage the strong positive correlation between opening and closing prices for intraday trading. Consider short-selling strategies based on high trading volumes.
Further Research: Investigate the impact of external factors on stock performance and perform a comparative analysis with other tech stocks.
Risk Management: Use volatility analysis to set appropriate stop-loss orders and consider the average daily range for setting entry and exit points.
Conclusion:
This comprehensive analysis of Apple Inc.'s stock data has provided valuable insights into its historical performance, trends, and patterns. By leveraging SQL for data extraction and R for visualization and statistical analysis, we have identified key relationships and trends that can inform investment strategies and support data-driven decision-making. The findings highlight the importance of understanding stock behaviour and the potential for using data analysis to enhance investment decisions.