Understanding Logistics Regression - A Practical Approach for the Beginner: Odds, Odds Ratio.
Logistic regression as per our last article, is a statistical process used to model the relationship between the probability of binary outcome of a dependent variable and one or more independent variables. Meaning that the dependent variable must be either 0 or 1 or 'life' or 'death' etc.So we use the independent variable to predict the probability of the outcome variable. In other words, the predictor variable is used to classify the dependent variable. Logistic regression can use continuous data such as age or weight etc in classification. There are two fundamental concepts that you need to understand about this model.
Logistic regression predicts a class label
It fits an s-curve shape to a function or data.
How Does it Work?
Logistic regression fits an s-shaped curve to the function of the data. It maps the input values, which are basically the independent variables (Student Marks, X-axis) to probabilities ('pass' or 'fail'), which are values ranging between 0 and 1(Y-axis) The s-curve then predicts the probability of a student passing or failing a course.
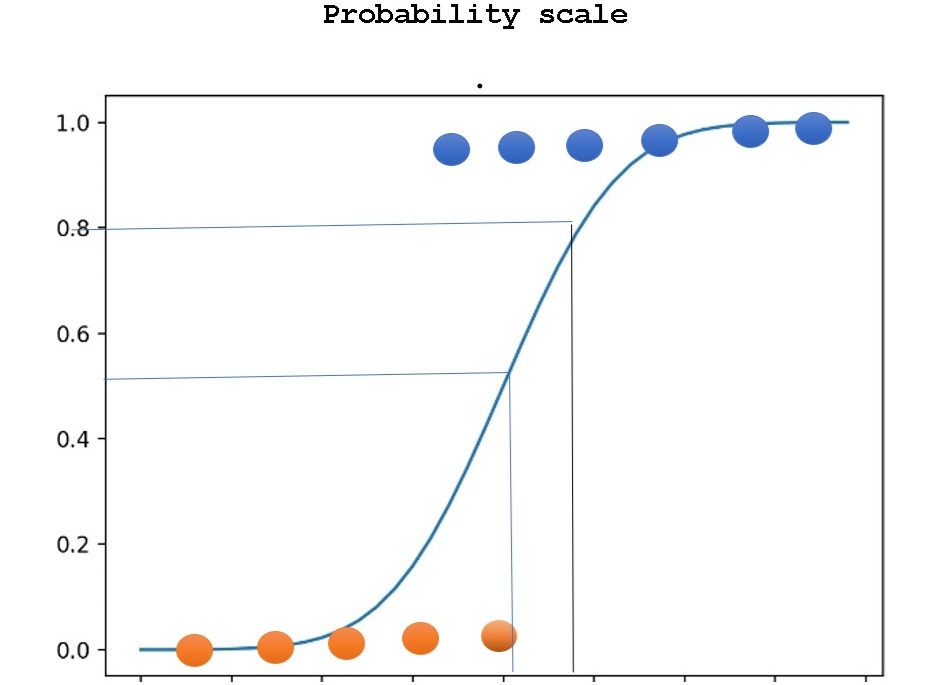
Probability Scale
Let us assume that a student scores a mark of 60% in a course, the model can predict a probability that the student has passed the course, meaning that the classification is a pass. On the other hand, the model will predict the probability of failure for any score falling below 50%. In other words, it will classify it as a failure.
Probability Scale Let us assume that a student scores a mark of 60% in a course, the model can predict a probability that the student has passed the course, meaning that the classification is a pass. On the other hand, the model will predict the probability of failure for any score falling below 50%. In other words, it will classify it as a failure.
So we have a simple model where the variable score is used to predict a student’s performance. We can complicate things a bit more by increasing the number of predictors to include student ‘Study hours’ but this will make it somehow awkward, to use the probability scale.
Simply because the probability scale is limited to values between zero and one, we, therefore, need another scale of measurement to expand this range, enter Odds and Odds Ratio.
Odds, Odds Ratio
The Odds of winning is defined as the number of successes over the number of failures. Say that you played a game of snake and ladders with a friend. You won three times and lost two times. The Odds of winning would be 3/2 = 1.5
The Odd Ratio is different in the sense that we divide the Odds Ratio of winning by another Odds Ratio. For instance, you might have played a second game of Snakes and Ladders with the odds of winning as follows: 2/5 = 0.4, meaning that you lost three games out of five.
The Odd Ratio is calculated as 1.5/0.4 =3.5. This is a ratio of Odds that is generally referred to as the Odds Ratio. Note that when the numerator is larger than the denominator, the values of the Odds ratio go from one to infinity and the converse is also true. However, it is important to realize that the Odds Ratio is different from the probability ratio.
The Difference Between Probability Ratio and Odd Ratio
There are a few differences between probability and Odd Ratio. They are different from each other by reason of concepts. They both deal with dividing one group by another. While the Odd Ratio deals with division by events, the probability ratio embraces division by probability.
Odd Ratio is calculated as the ratio of success to failure so that it is always weighing the chances that favor's an event rather than against it. It is calculated by dividing the probability of success by the probability of failure and can be expressed in many forms including; ratio, decimal or even a fraction.
Probability on the other hand is the ‘fraction of times you expect to see a particular event in many trials’, with values ranging from zero to one. It is expressed in terms of the likelihood of an event occurring. Like the Odd Ratio, probability outcome can take the form of a fraction, ratio or even percentage.